

Vizuators' blog
25 Ways to Compare Periods
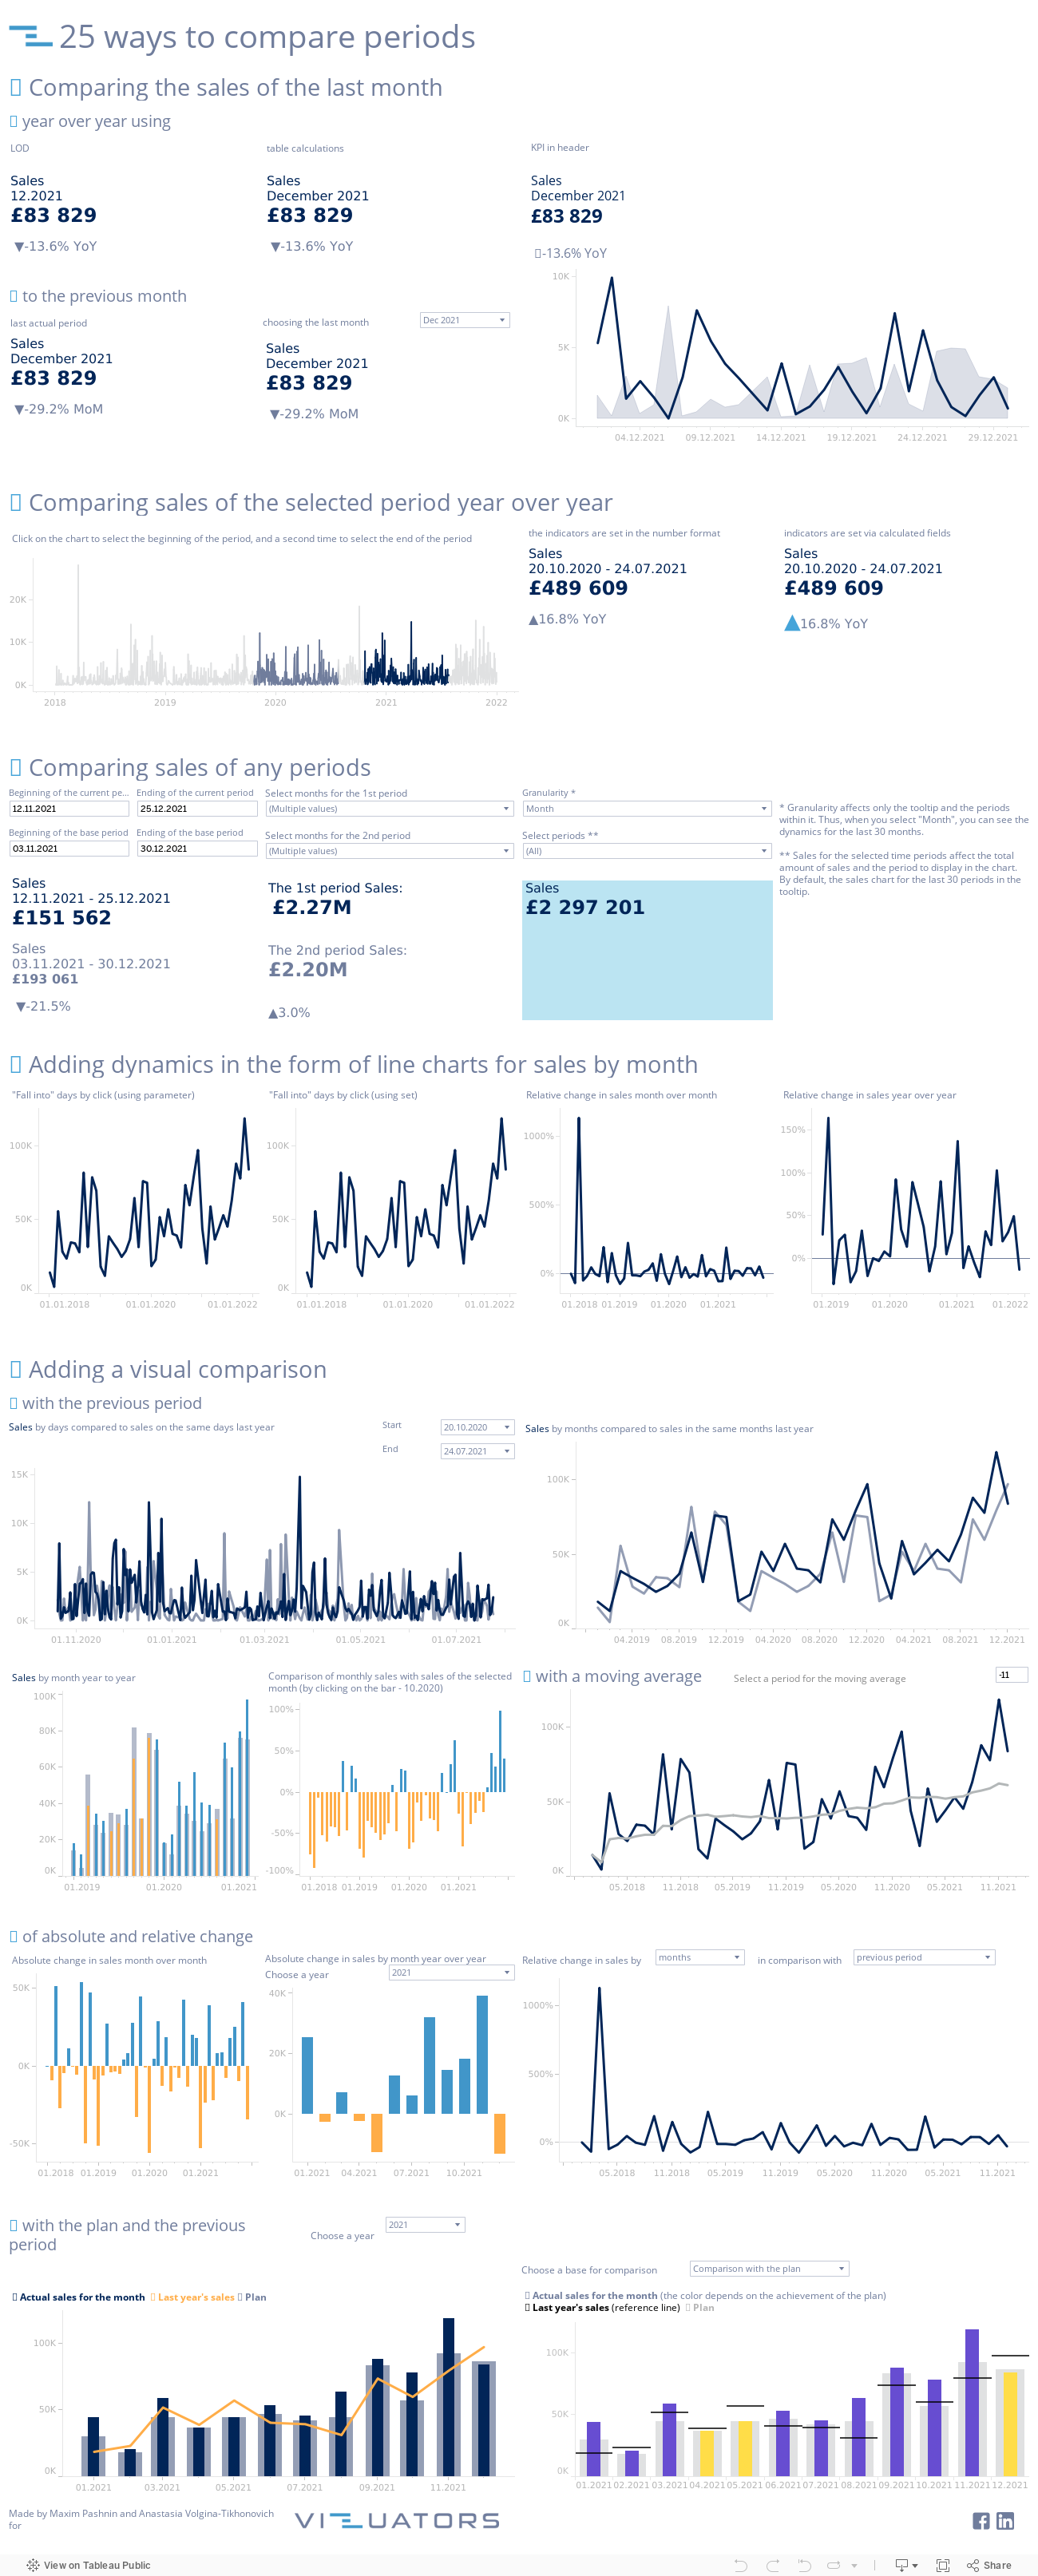
We present to your attention a dashboard assistant. This handy cheat sheet is based entirely on Vizuators' development experience.
- One of the most common tasks of almost all business dashboards is to compare before and after.
There is usually a minimal set of comparisons to the previous month/year/quarter/week in absolute and relative terms.
Often a comparison with a plan is added to this. But there are also rarer requests. -
This dashboard will help analysts and businesses understand the tool's capabilities, the data requirements, and the speed and complexity of the presented solutions.
The dashboard is built on Sample Superstore data.
Do you want the same
informative reports?
Take advantage of our development experience, and let's discuss the possibilities
of a joint project for your analytics.
By clicking the button, you agree to the processing of personal data. We use it to stay connected.

Contact us