

Vizuators' blog
Map layers for
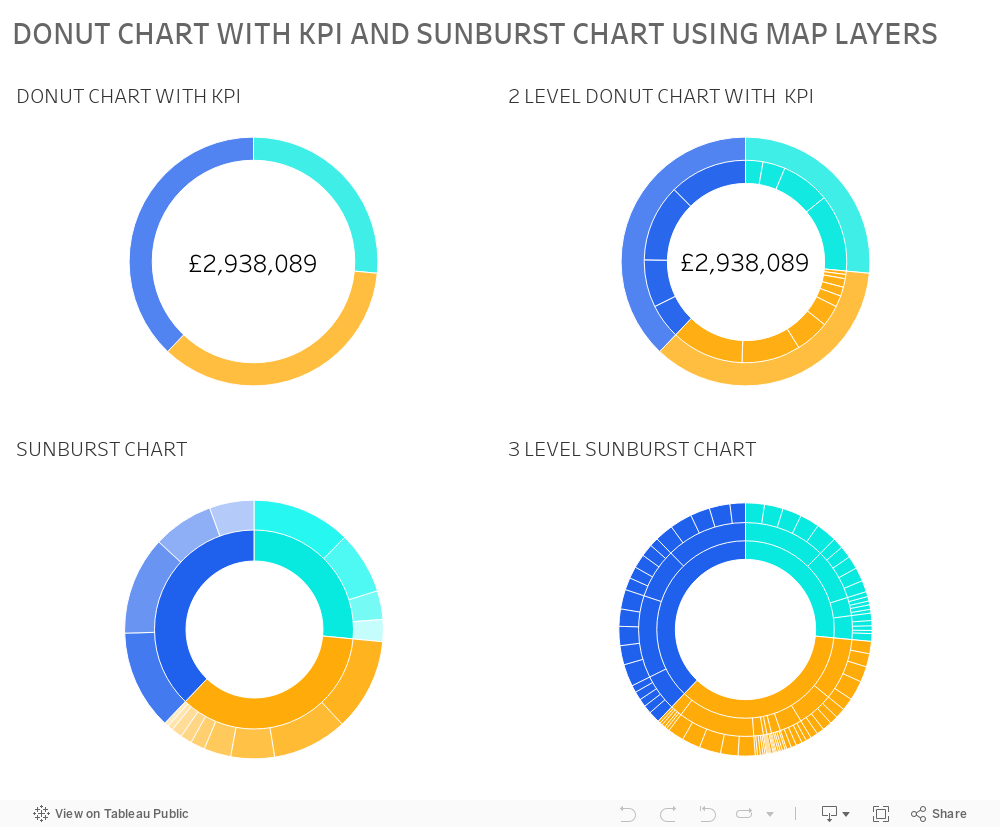
Donut and Sunburst diagram
The donut chart is one of the most seen charts from the time of Excel. It is usually built-in Tableau using two pie charts (one with sectors, the second with a white circle), combined using a Dual Axis. But what if another level is needed? We've got that question while developing a dashboard for a customer.
And what if we create a Sunburst chart? Step-by-step instructions from the Internet contain many calculations and additional sources. Calculations for Tableau are not a problem (it would instead not get confused), but you can not always add another source to a book.
We offer a simple way to solve such issues with only one additional field; the others you will take from the existing source!
We offer a simple way to solve such issues with only one additional field; the others you will take from the existing source!

Let's Build!
The first step to begin is creating a field point.


Then add it to the map.
Let's run away from a map to a donut chart.
- Change the mark type to "Pie" and fill the Angle with a measure of Sales in the dataset. Then drag Category to Color.
- Then type CTRL+SHIFT+B to zoom your circle and remove the map from the background.
- We get a standard pie chart.

Now let's make a donut chart with a factoid in the middle.
Return the background with the map and add a point-field as another layer.

How to add a point-field as map-layer


Tip
Something non-obvious (map layers)
allows you to get something incredible (multi-level pie charts).
Explore our possibilities
Use proved Tableau expertise
By clicking the button, you agree to the processing of personal data. We use it to stay connected. Read more

Contact us