


Displaying the Upper and Lower Steps
of the Waterfall Chart
Case 10.
Such a display of steps in a waterfall chart facilitates a visual comparison of the beginnings and ends of bars.
How do displaying the upper and lower steps
of the waterfall chart help?
of the waterfall chart help?
- Displaying the upper and lower steps of the waterfall chart helps to provide a visual representation of the cumulative effect of each step in the process.
-
It allows viewers to quickly and easily identify the differences between the starting and final values and the individual steps that contribute to the overall result.
- It also allows for easy comparison of the relative contribution of each step to the overall result.
How to display the upper and lower steps of the waterfall chart
How to display the upper and lower steps of the waterfall chart
Check our Tableau Public workbook for step-by-step instructions.
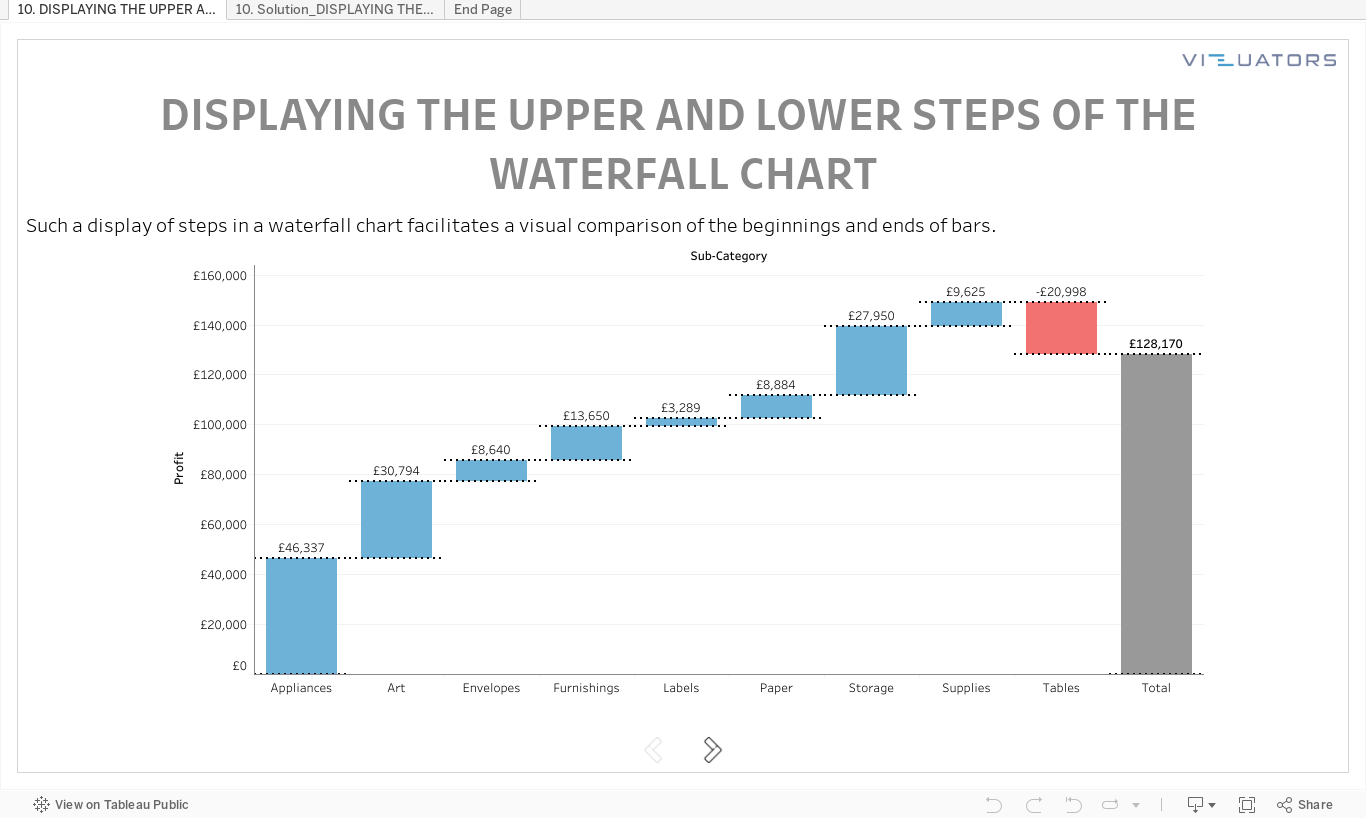
Tableau practice is the best way to develop your data visualization skills. Therefore, our team trains Tableau skills by solving additional tasks of varying complexity. Then we meet via Zoom and discuss all possible solutions.
We call it Tableau Challenges and invite you to participate!
We call it Tableau Challenges and invite you to participate!
Take your free
Tableau workbook
Leave your mail, and we will send you a workbook with the tasks and a link
to the solution registration page.
Enjoy experts' solution analysis with Vizuators team!
to the solution registration page.
Enjoy experts' solution analysis with Vizuators team!
By clicking the button, you agree to the processing of personal data. We use it to stay connected. Read more

Contact us