


Control Chart
Case 11.
A control chart is a statistical process control tool used to determine if a manufacturing or business process is in control. It always has a central line for the average, an upper line for the upper control limit, and a lower line for the lower control limit (e.g., standard deviation).
A control chart use cases
- Quality Control: Control charts monitor processes for any significant deviations. It can help identify special-cause variations and take corrective action.
-
Capacity Management: Control charts can be used to monitor key performance indicators and inform decisions about capacity management.
- Process Improvement: Control charts can be used to track the progress of process improvements over time. The upper and lower control limits can be used to define the acceptable range of variation.
- Root Cause Analysis: Control charts can help identify root causes of variation. Identifying points on the graph that are significantly outside the control limits makes it possible to pinpoint the source of the interpretation and take corrective action.
How to implement a control chart
How to implement a control chart
Check our Tableau Public workbook for step-by-step instructions.
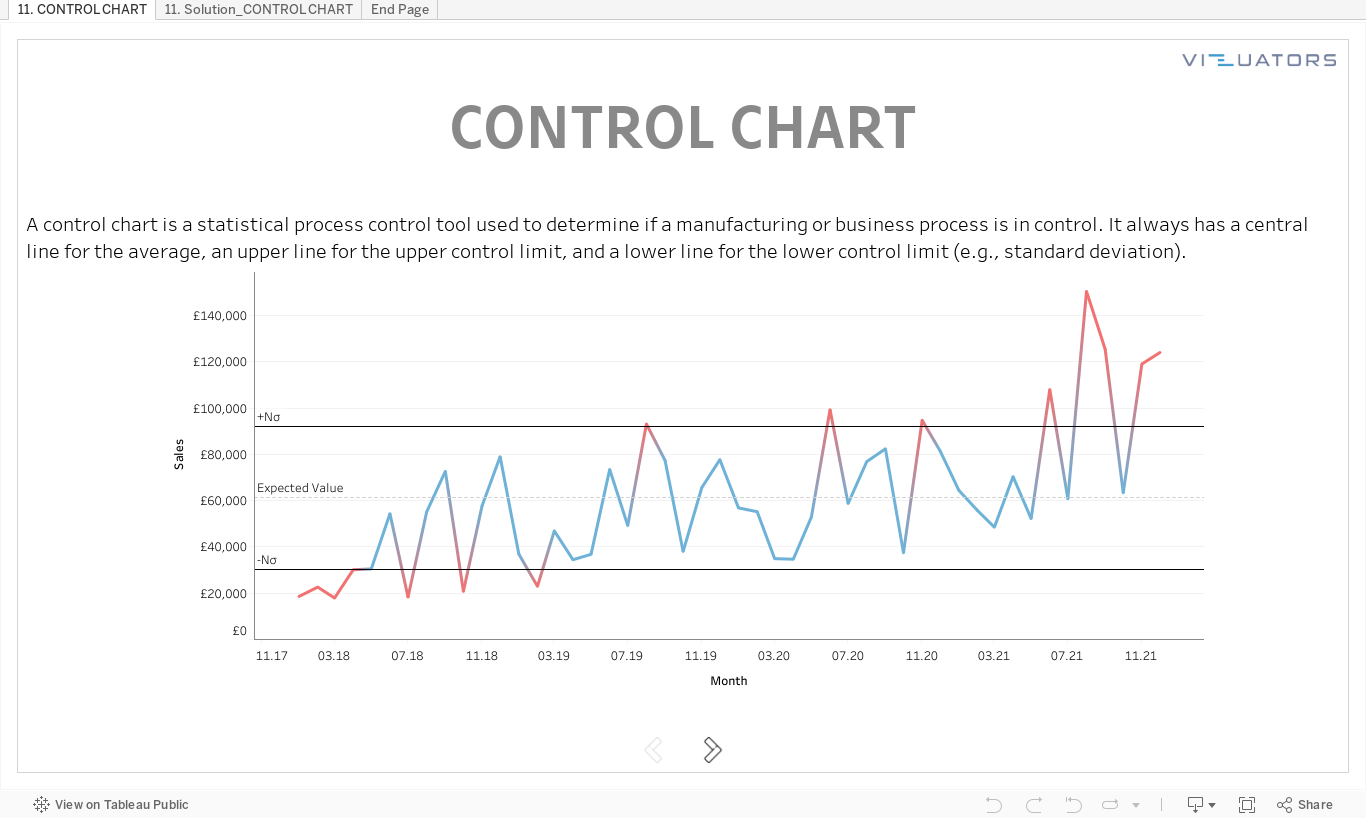
Tableau practice is the best way to develop your data visualization skills. Therefore, our team trains Tableau skills by solving additional tasks of varying complexity. Then we meet via Zoom and discuss all possible solutions.
We call it Tableau Challenges and invite you to participate!
We call it Tableau Challenges and invite you to participate!
Take your free
Tableau workbook
Leave your mail, and we will send you a workbook with the tasks and a link
to the solution registration page.
Enjoy experts' solution analysis with Vizuators team!
to the solution registration page.
Enjoy experts' solution analysis with Vizuators team!
By clicking the button, you agree to the processing of personal data. We use it to stay connected. Read more

Contact us