


Adding a Reference
Box to a Scatter Plot
Case 15.
Adding a custom reference box is an excellent way to highlight statistically essential areas. For example, the area from 25 to 75 percentiles in profit and 25 to 75 percentiles in sales is taken as statistically meaningful.
Why are reference boxes added to charts?
Why are reference boxes added to charts?
- Reference boxes are typically added to line charts, bar charts, and scatter plot charts.
- Reference boxes provide additional context or information about the data displayed in the chart. They are commonly used to provide labels and descriptions of the different axes, to show the range or scale of the data, or to provide additional details about the data set being plotted.
- You can use custom reference boxes to show off success stories and other relevant content that your users may find valuable. For example, you could use a custom reference box to showcase case studies or customer testimonials.
How to add a reference box
to scatter plot
How to add a reference box
to scatter plot
Check our Tableau Public workbook for step-by-step instructions.
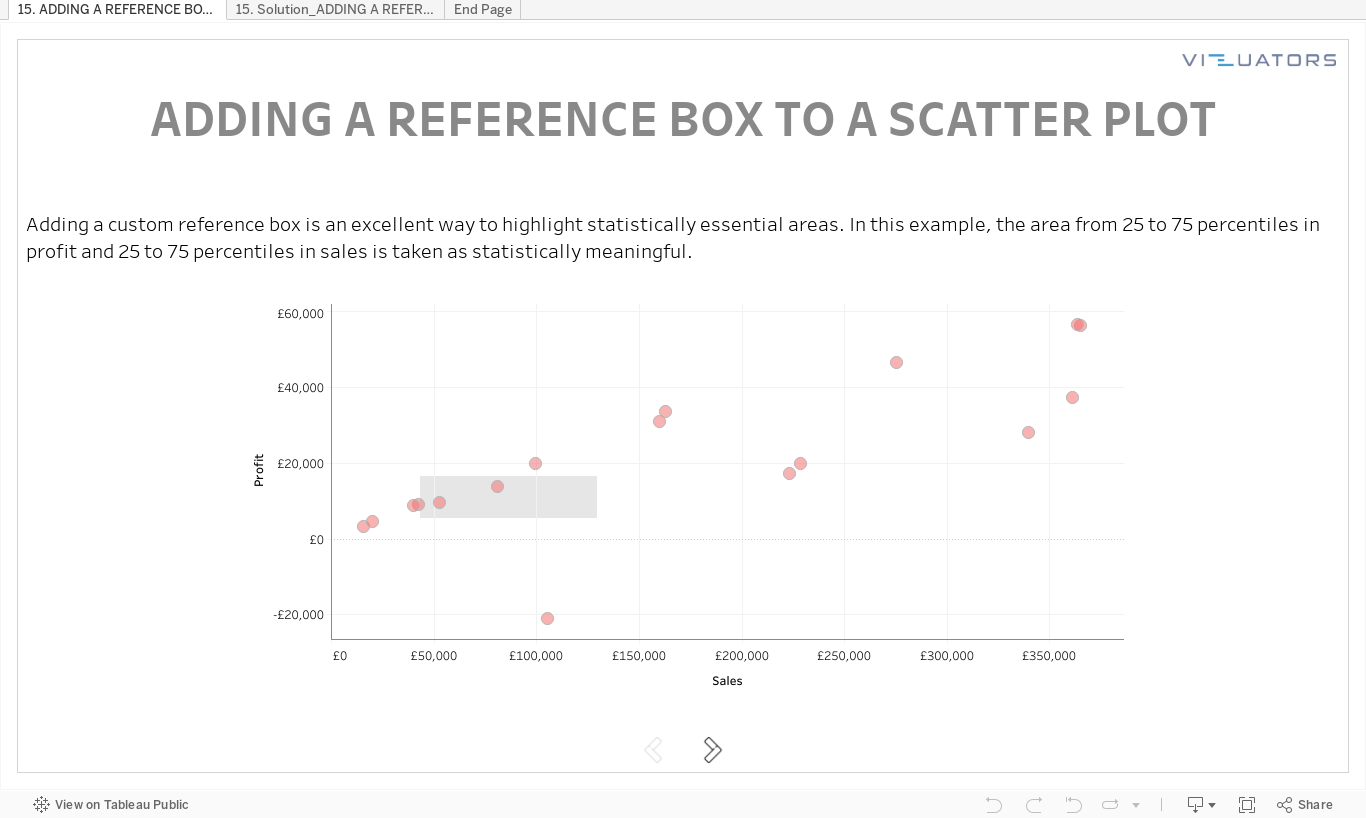
Tableau practice is the best way to develop your data visualization skills. Therefore, our team trains Tableau skills by solving additional tasks of varying complexity. Then we meet via Zoom and discuss all possible solutions.
We call it Tableau Challenges and invite you to participate!
We call it Tableau Challenges and invite you to participate!
Take your free
Tableau workbook
Leave your mail, and we will send you a workbook with the tasks and a link
to the solution registration page.
Enjoy experts' solution analysis with Vizuators team!
to the solution registration page.
Enjoy experts' solution analysis with Vizuators team!
By clicking the button, you agree to the processing of personal data. We use it to stay connected. Read more

Contact us