


Histogram with Additional Detail
Case 17.
A regular histogram shows the distribution of a measure. Did you know that you can add additional detail to the histogram? For example, let's look at the distribution of the number of orders per customer, add granularity by the customer, and color coding for profit from each customer.
Why add extra detail to the histogram
Why add extra detail to the histogram
- Showing distribution of the number of orders per customerhelp businesses understand their customer base and identify which customers contribute the most to their overall sales. It can also identify trends in customer behavior, such as which customers order more frequently over time.
- Granularity by customer visualizationhelps businesses to gain insights into their customer base.It can be used to identify patterns and trends in customer behavior and make decisions about optimizing customer experiences best. With granularity by customer visualization, businesses can quickly identify which customers are more likely to purchase a particular product or service, determine which customers are most likely to abandon a purchase, and remember which customers are most likely to remain loyal to the company. This data can inform marketing campaigns and other strategies to ensure the best customer experience.
- Color coding for profit from each customera way of displaying the data to show the profitability of each customer. This type of visualization will show the customer's total profit and a breakdown of the different kinds of revenue and expenses that make up that customer's profit. For example, a customer's income could be represented as green, while their costs could be described as red. It enables the user to quickly understand the customer's profitability and identify the most profitable customers. Additionally, color coding can show customer profitability trends over time.
How to add detail to a histogram
How to add detail to a histogram
Check our Tableau Public workbook for step-by-step instructions.
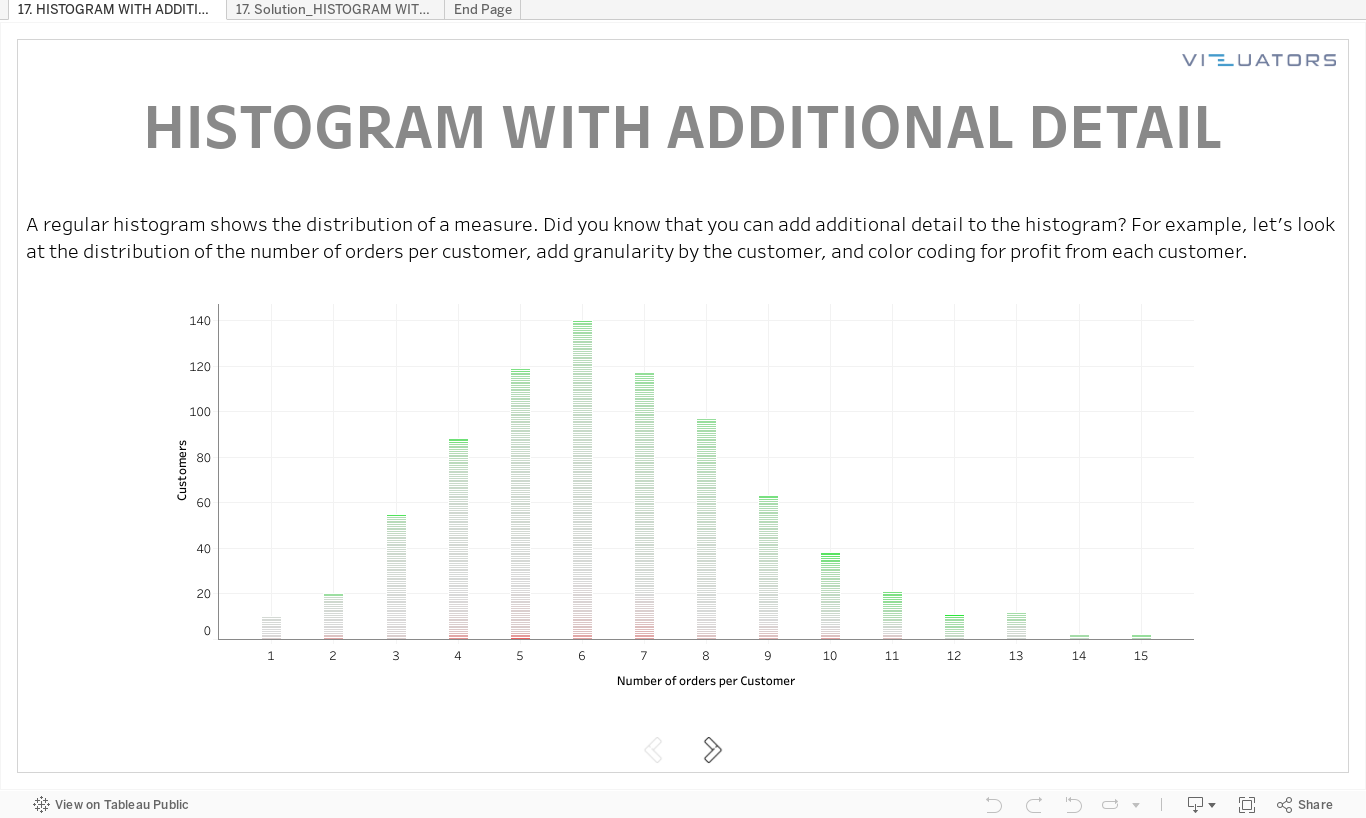
Tableau practice is the best way to develop your data visualization skills. Therefore, our team trains Tableau skills by solving additional tasks of varying complexity. Then we meet via Zoom and discuss all possible solutions.
We call it Tableau Challenges and invite you to participate!
We call it Tableau Challenges and invite you to participate!
Take your free
Tableau workbook
Leave your mail, and we will send you a workbook with the tasks and a link
to the solution registration page.
Enjoy experts' solution analysis with Vizuators team!
to the solution registration page.
Enjoy experts' solution analysis with Vizuators team!
By clicking the button, you agree to the processing of personal data. We use it to stay connected. Read more

Contact us