


Displaying a Sheet for Only One Mark in a Tooltip
Case 22.
In the principles of proper visualization, there is a rule to use only a few marks on the chart. Instead, you can use the grouping method according to any logic. But what if you need to display the members of the group in some way? Use the tooltip!
In our example, we will show the top 5 sub-categories by sales and group the remaining sub-categories into the value Others. A list of sub-categories that still need to enter the top 5 and their sales will be displayed by hovering over the Others mark.
How detailed tooltip for a single mark help
- Single-mark tooltips show information such as the data point's value, label, or category and additional context information related to that data point.
- For instance, a single-mark tooltip may show the exact value of a data point, along with a description of what that value means.
- Additionally, it might include other relevant information, such as the date and time the data point was collected.
How to display a sheet for only one mark in a tooltip
How to display a sheet for only one mark in a tooltip
Check our Tableau Public workbook for step-by-step instructions.
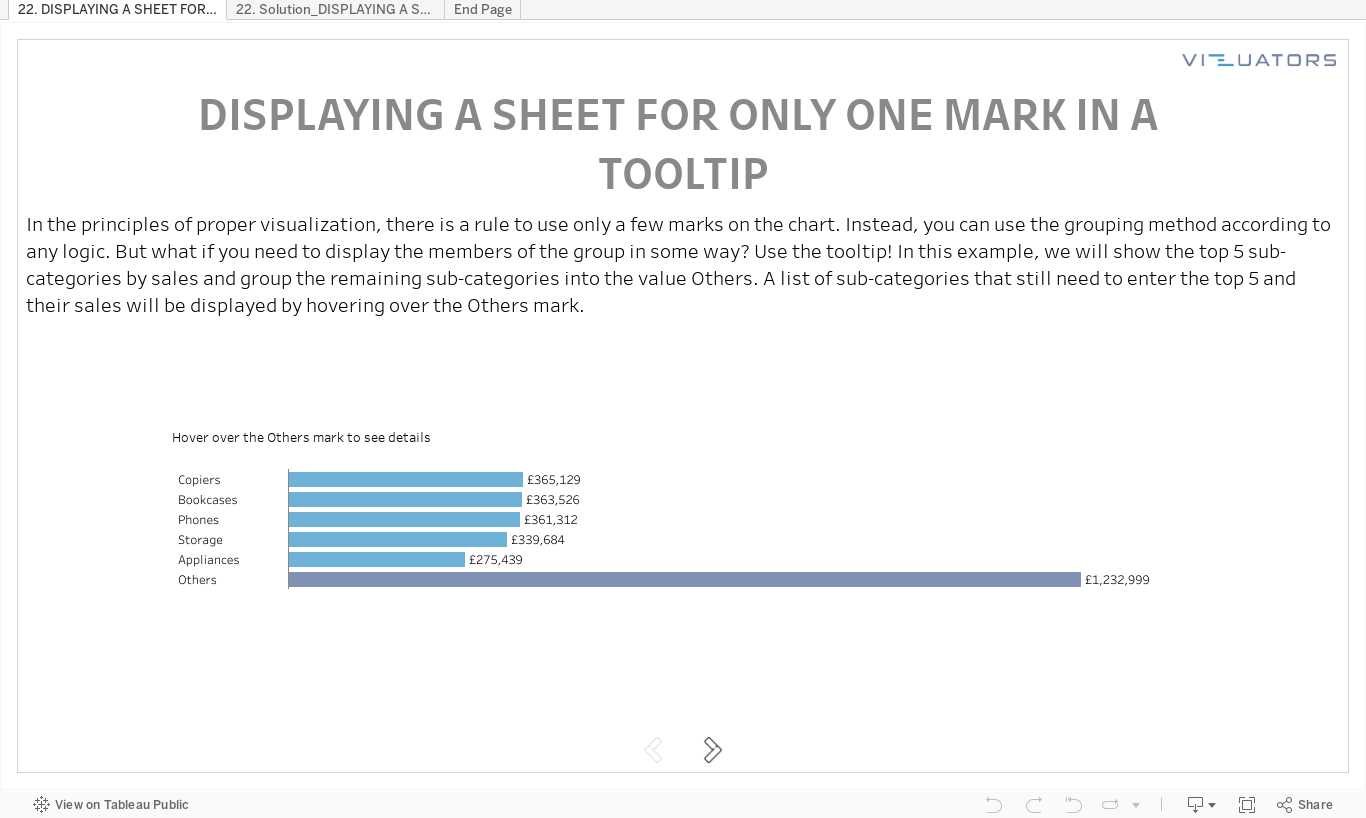
Tableau practice is the best way to develop your data visualization skills. Therefore, our team trains Tableau skills by solving additional tasks of varying complexity. Then we meet via Zoom and discuss all possible solutions.
We call it Tableau Challenges and invite you to participate!
We call it Tableau Challenges and invite you to participate!
Take your free
Tableau workbook
Leave your mail, and we will send you a workbook with the tasks and a link
to the solution registration page.
Enjoy experts' solution analysis with Vizuators team!
to the solution registration page.
Enjoy experts' solution analysis with Vizuators team!
By clicking the button, you agree to the processing of personal data. We use it to stay connected. Read more

Contact us