


Case 3.
Conditional
Mark Labels
Conditional mark labels eliminate "visual noise" on visualizations. The conditions of labeling can be completely different. For example, to label only non-repeating values, every third mark, only those bars in which there is a specific dimension division, and so on.
How do conditional mark labels help?
- Conditional mark labels are a helpful tool in data visualization. They allow users to quickly and easily identify the meaning of each mark on a chart or graph.
- Conditional mark labels allow data points to be identified without reading long text descriptions or charts. It makes data easier to understand and enables users to identify trends and patterns quickly. For example, mark labels can be used in a scatter plot to identify points with different colors, sizes, or shapes. It helps users quickly identify data patterns, clusters, and trends.
- In addition, conditional mark labels make data more accessible and understandable to a broader audience. By providing labels to each mark, users can quickly identify which data point they are looking at, thus making data more accessible to those who may not be familiar with the data.
How to implement conditional mark labels
How to implement conditional mark labels
Check our Tableau Public workbook for step-by-step instructions.
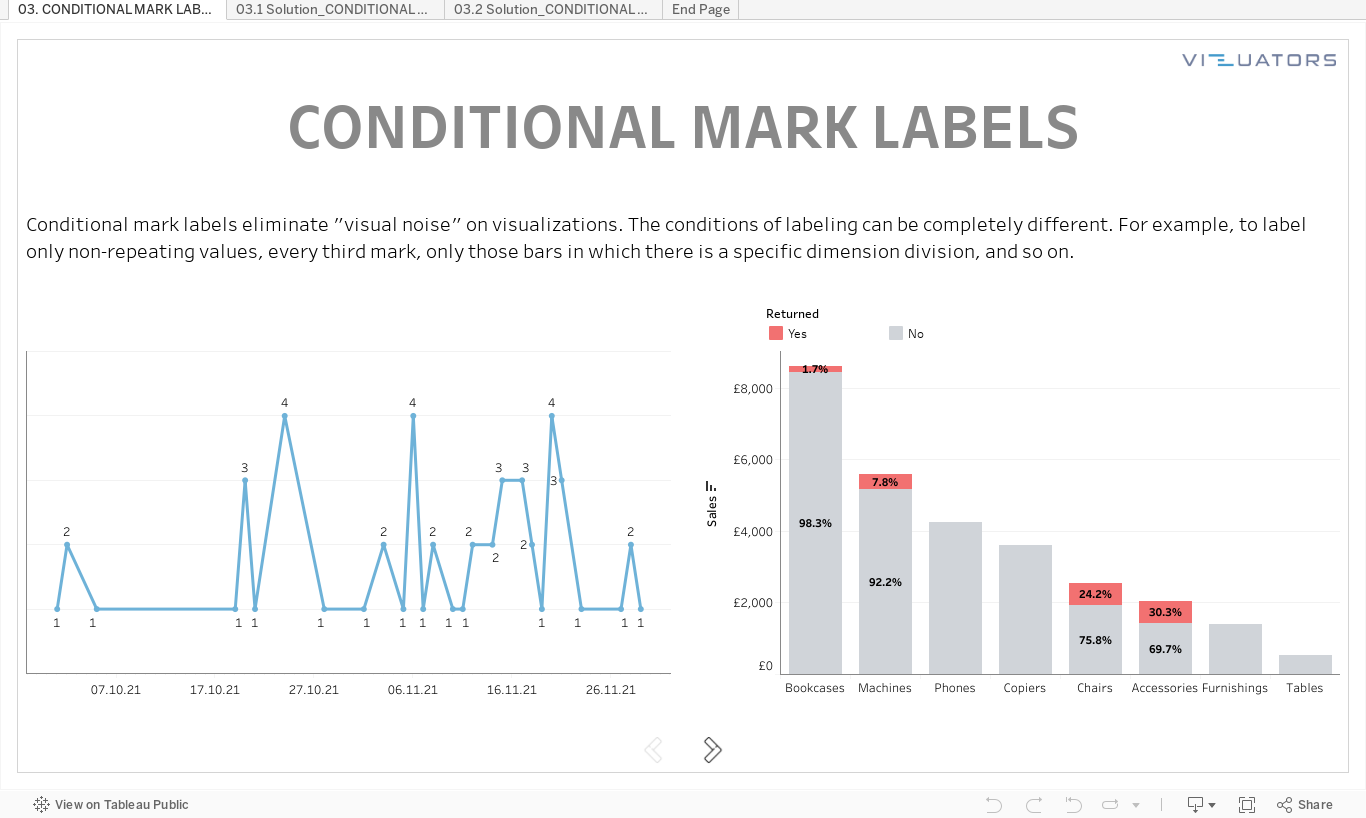
Tableau practice is the best way to develop your data visualization skills. Therefore, our team trains Tableau skills by solving additional tasks of varying complexity. Then we meet via Zoom and discuss all possible solutions.
We call it Tableau Challenges and invite you to participate!
We call it Tableau Challenges and invite you to participate!
Take your free
Tableau workbook
Leave your mail, and we will send you a workbook with the tasks and a link
to the solution registration page.
Enjoy experts' solution analysis with Vizuators team!
to the solution registration page.
Enjoy experts' solution analysis with Vizuators team!
By clicking the button, you agree to the processing of personal data. We use it to stay connected. Read more

Contact us