


Case 8.
Scatter Plot +
Dynamic of Chosen Dimension Value
This type of chart allows tracking a particular measure and the day of the last purchase for several marks and the dynamics of the measure of the selected marks.
How do scatter plots and dynamics of chosen dimension value combining help?
- Combining a scatter plot with the dynamic of a chosen dimension value can help better visualize how two different variables are related.
- It can show how changes in one variable affect the other, which can help identify correlations and trends.
- Additionally, it can provide a more comprehensive view of the data, providing insights that are not possible with a single variable.
How to combine scatter plot + dynamic of chosen dimension value
How to combine scatter plot + dynamic of chosen dimension value
Check our Tableau Public workbook for step-by-step instructions.
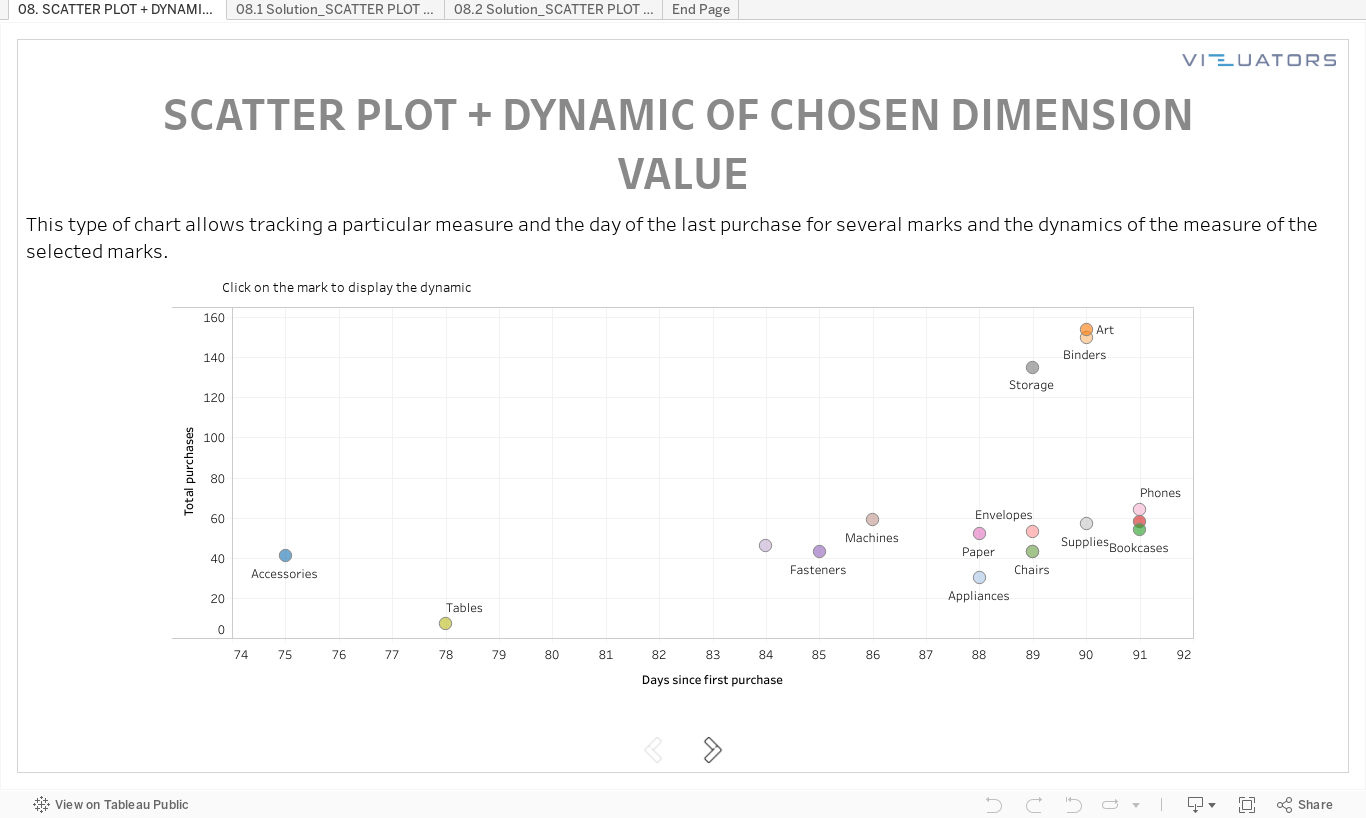
Tableau practice is the best way to develop your data visualization skills. Therefore, our team trains Tableau skills by solving additional tasks of varying complexity. Then we meet via Zoom and discuss all possible solutions.
We call it Tableau Challenges and invite you to participate!
We call it Tableau Challenges and invite you to participate!
Take your free
Tableau workbook
Leave your mail, and we will send you a workbook with the tasks and a link
to the solution registration page.
Enjoy experts' solution analysis with Vizuators team!
to the solution registration page.
Enjoy experts' solution analysis with Vizuators team!
By clicking the button, you agree to the processing of personal data. We use it to stay connected. Read more

Contact us