


Case 4.
Restarting
Running Functions
Sometimes there may be a need to separate the cumulative total chart into several logical parts (for example, before and after a critical date) to track and compare the indicator over several time intervals. In such cases we use restarting running functions.
How do restarting running functions help?
- Restarting running functions in data visualization is a powerful way to change an existing visualization quickly. It allows for quick and easy updates to the visualization, such as changing the type of chart, adding or removing data points, or adjusting the range and scale of the axes.
- Additionally, restarting running functions can quickly re-run a visualization with different parameters, such as other data sources or various color schemes.
- It makes it easy to compare different visualization versions or troubleshoot a chart quickly.
How to implement restarting running functions
How to implement restarting running functions
Check our Tableau Public workbook for step-by-step instructions.
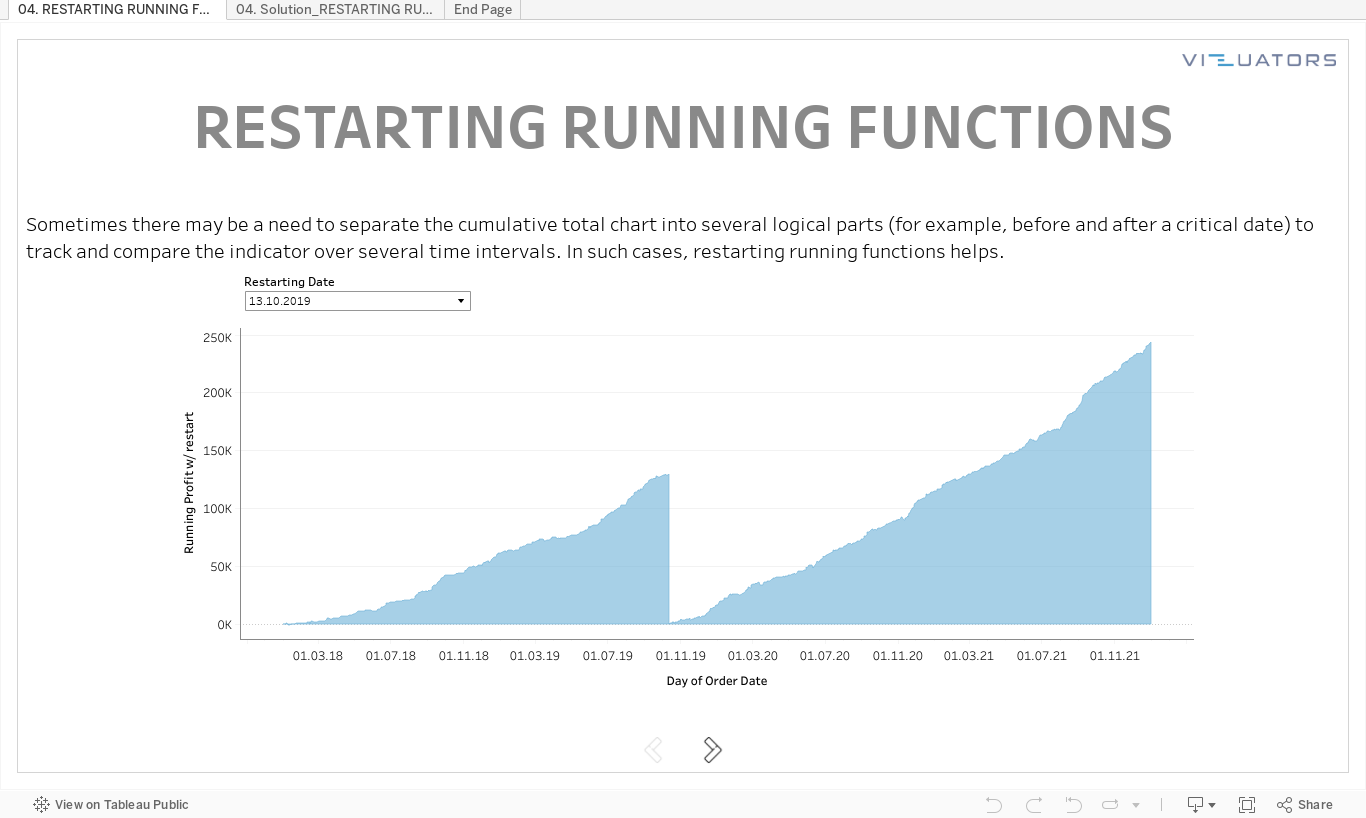
Tableau practice is the best way to develop your data visualization skills. Therefore, our team trains Tableau skills by solving additional tasks of varying complexity. Then we meet via Zoom and discuss all possible solutions.
We call it Tableau Challenges and invite you to participate!
We call it Tableau Challenges and invite you to participate!
Take your free
Tableau workbook
Leave your mail, and we will send you a workbook with the tasks and a link
to the solution registration page.
Enjoy experts' solution analysis with Vizuators team!
to the solution registration page.
Enjoy experts' solution analysis with Vizuators team!
By clicking the button, you agree to the processing of personal data. We use it to stay connected. Read more

Contact us